Machine Learning Trading
Regression
8 minute read
Notice a tyop typo? Please submit an issue or open a PR.
Regression
Parametric Regression
We are first going to focus on parametric regression, whereby we fit a model to data using a set of parameters.
Let's start with a simple example. Suppose we want to build a model that can predict how much it will rain today based on changes in barometric pressure.
Generally, a decline in barometric pressure indicates that bad weather and rain are coming, while an increase in barometric pressure means that fairer weather is imminent.
Let's look at the following scatterplot, where each point maps a change in barometric pressure on the -axis to the corresponding amount of rainfall on the -axis.
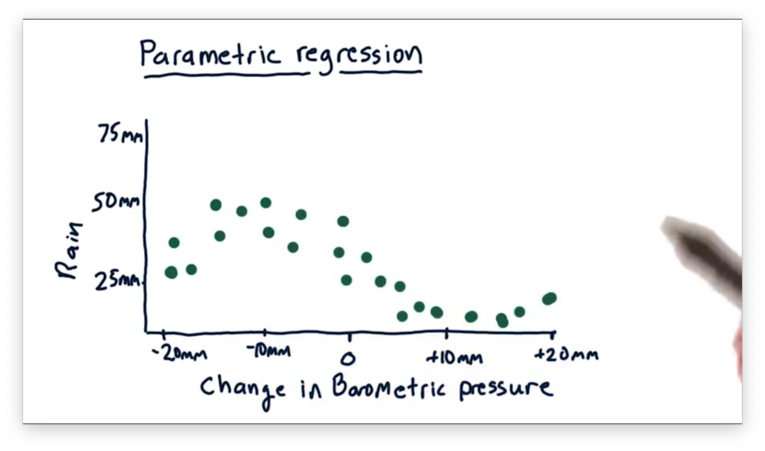
We can see a general trend here, and indeed it follows our intuition: as barometric pressure increases, rainfall tends to decrease.
We want to create a model, based on this data, that we can query for any change in barometric pressure - not just the examples we've already seen - and get a resulting prediction for rainfall.
The classic solution to this problem is to fit a line to the data, and we've plotted one such line below.
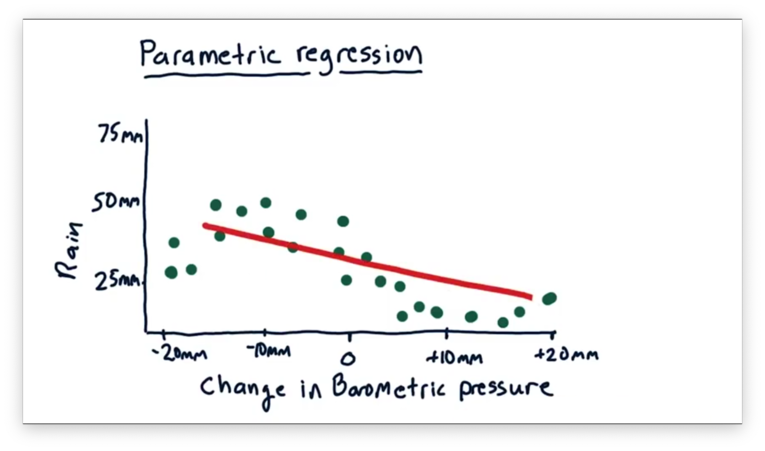
This approach is called linear regression, and the resulting model can be described using the equation for a line: . In this model, is the observed change in barometric pressure, is the predicted amount of rainfall, and and are the parameters that we must learn.
Once we learn and , we can query our model for any and get a corresponding .
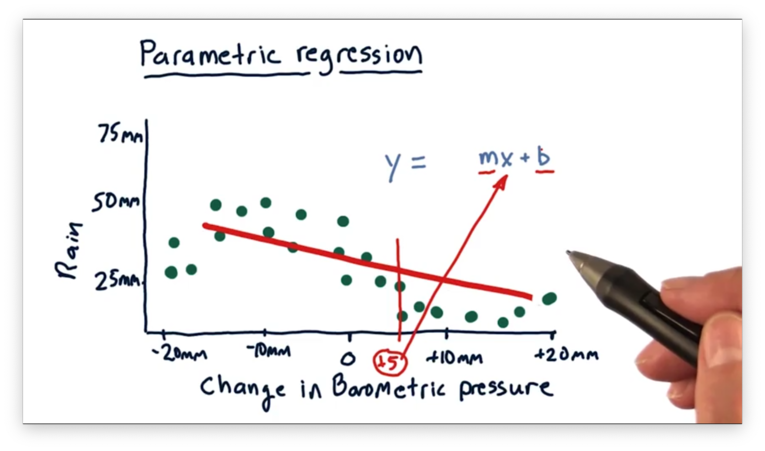
This model is decent, but it doesn't accurately track the behavior of the data. As we can see, the data "curves" up and then back down, and a linear model can't capture this type of movement.
So, we can generate a more complex model. Instead of fitting a line, we can fit a polynomial: . With this model, we have to learn three parameters, whereas we only had to learn two with the simpler linear model.
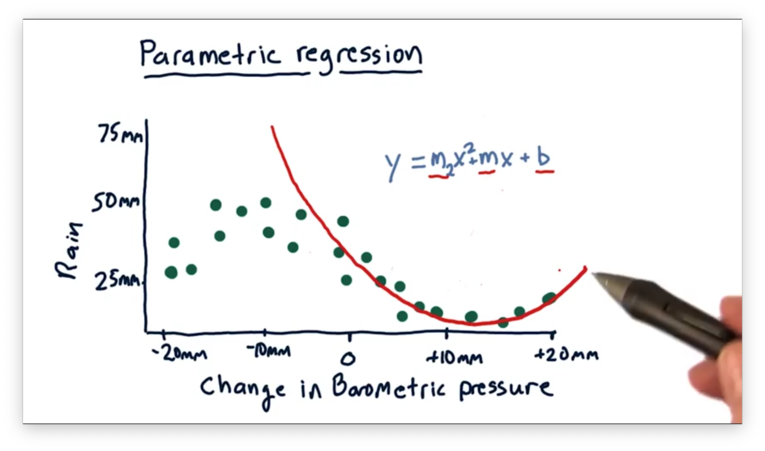
Notice that this polynomial model fits the data much better than the linear model for . However, the model fits the data for pretty poorly. As you might imagine, we could add an term to our model to help better fit that portion of the data.
After we learn the parameters for a model, we can throw away the training data and retain only the parameters that describe the model. For a polynomial of order , we only need to store values, which makes these regression models very space-efficient.
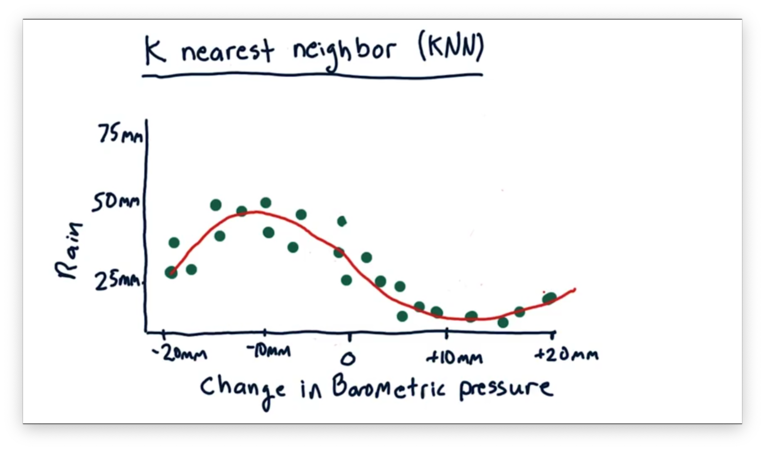
K-Nearest Neighbor
Instead of using a parametric approach, we can use an instance-based regression approach like KNN. In KNN, we retain all of our data and utilize it when we make a query.
Let's recall our scatterplot from before, which demonstrates a relationship between change in barometric pressure and rainfall.
Suppose we want to query our model to predict how much rainfall we should expect for a change in barometric pressure of -5mm.
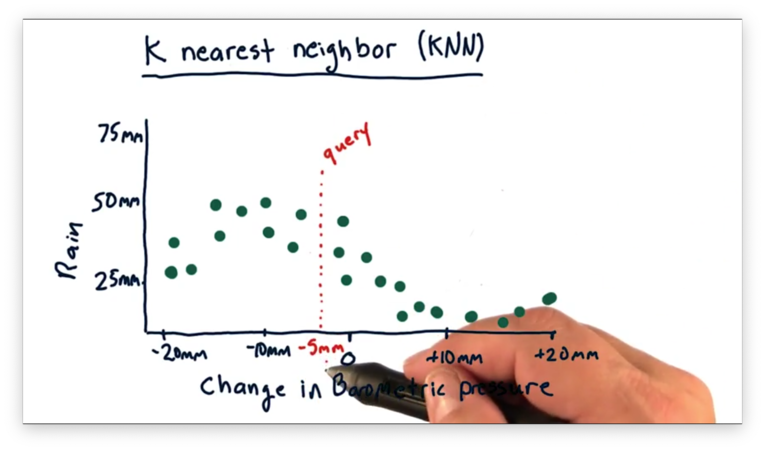
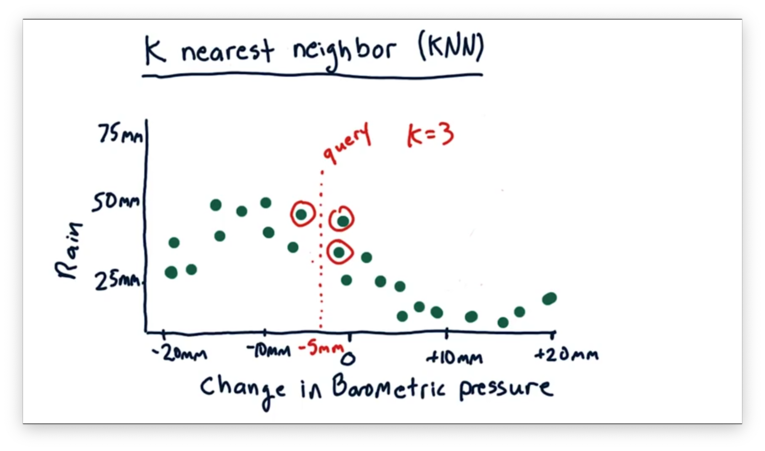
With KNN, we find the nearest historical data points to our query and use them to estimate the prediction. In this case, .
How to Predict Quiz
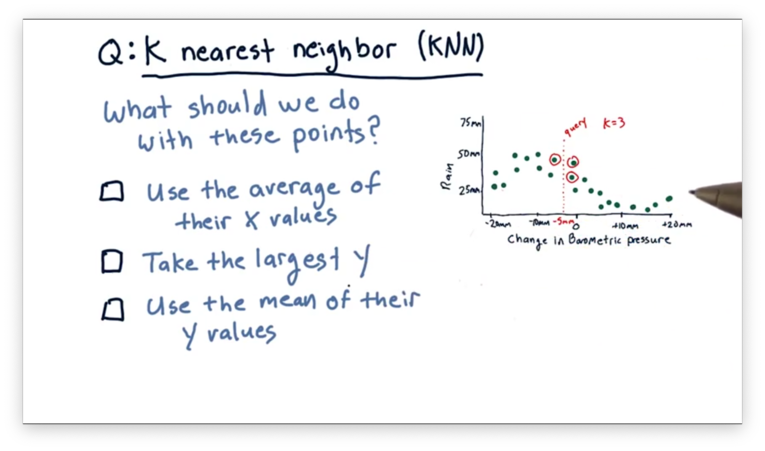
We've identified that, in KNN, for a particular query , we want to utilize the nearest data points to to come up with a prediction. What should we do with those neighboring data points to find that prediction?
How to Predict Quiz Solution
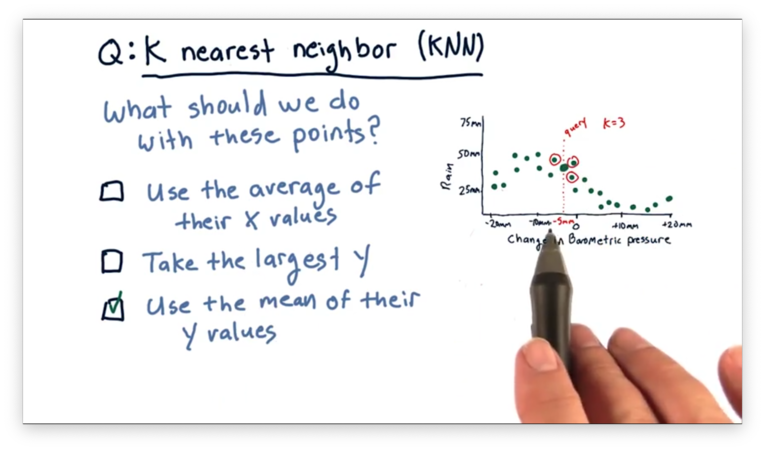
Remember that we want to predict a -value for the queried -value. As a result, it doesn't make sense to take the average of the -values of the nearest neighbors. Additionally, we don't want to take the largest -value; otherwise, the other neighbors have no influence on the prediction. The correct approach here is to take the mean of their -values.
Kernel Regression
We said that the correct method of combining nearest neighbors to make a prediction is to take the average of their -values. If we repeated this process at many points along the -axis, we would generate a model that looks like the following.
Besides KNN, there are several other instance-based regression methods, such as kernel regression. Whereas in KNN, we take an unweighted average of the nearest neighbors, in kernel regression, we weight the contributions of each neighbor according to its distance from the query.
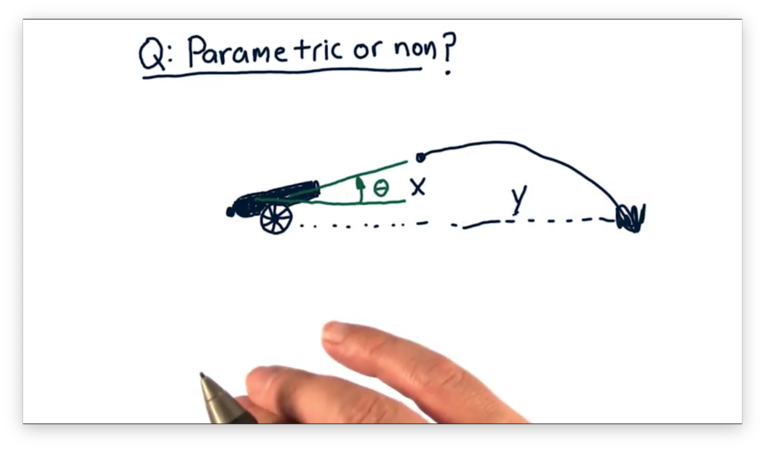
Parametric vs Non-Parametric Quiz
Let's consider the relationship between variables in two different scenarios.
The first scenario involves firing a cannon. The independent variable is the value of the angle that the cannon makes with the ground, and the dependent variable is the horizontal distance the cannonball travels.
The second scenario involves attracting bees to a food source. The independent variable is the richness of the food source, and the dependent variable is the number of bees attracted to that source.
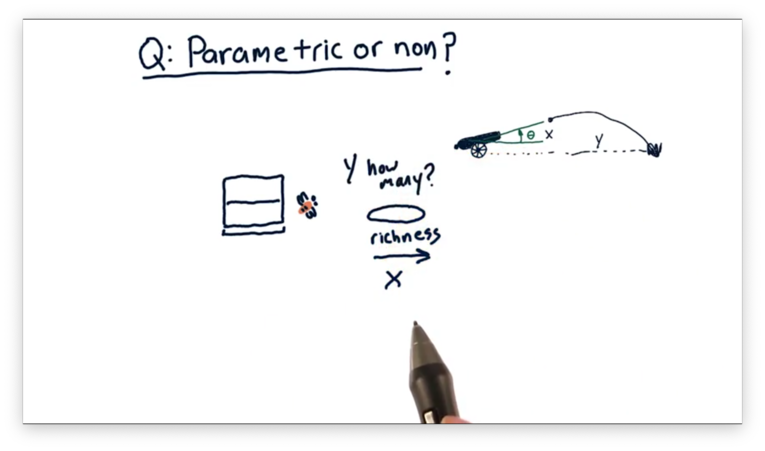
Note that this scenario is slightly different than the first because it's not clear that the number of bees always increases as richness increases.
Given these two scenarios, which, if any, is better modeled using a parametric model, and which, if any, is better modeled using a non-parametric model?
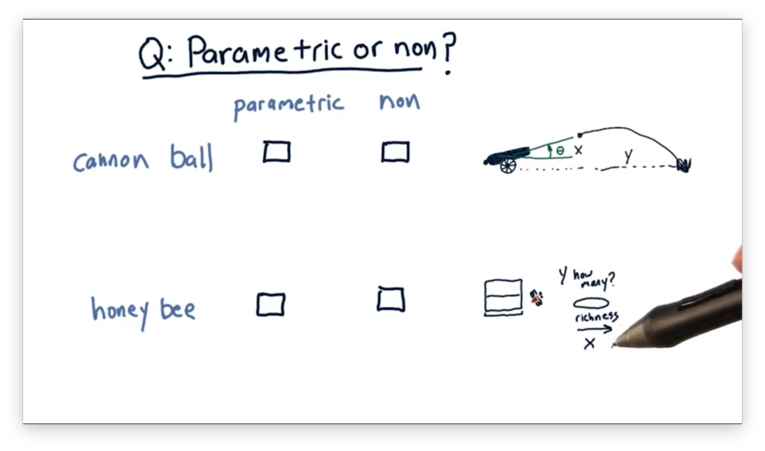
Parametric vs Non-Parametric Quiz Solution
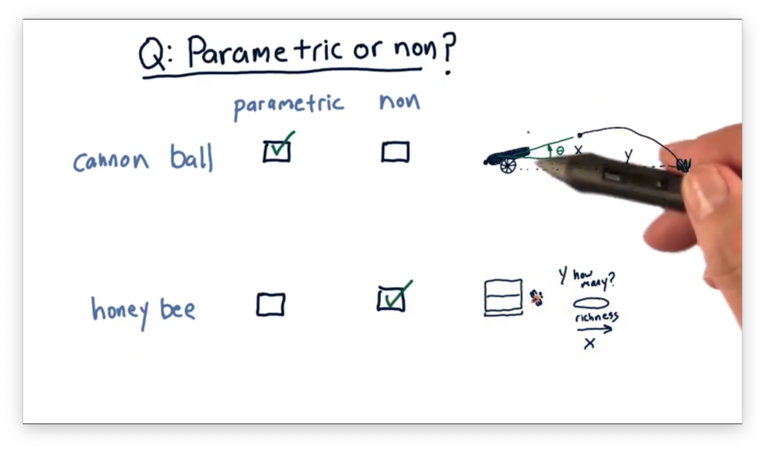
In the first scenario, we can start with an estimate of the underlying behavior of the system in terms of a mathematical equation that expresses how it behaves. This equation is just the equation of trajectory, which we can find online. We can then learn the parameters of this equation such that it describes the relationship between our variables.
In the second scenario, we have no initial estimate for the underlying mathematical equation, so it's better to use a non-parametric model, which can model any "shape" of relationship.
Training and Testing
Let's consider the data that we typically use in a finance-based machine learning problem. We have the features that we measure - metrics like Bollinger Bands, momentum, P/E ratio, among others - and the corresponding prices or price changes that we observe.
We want to learn a model that correctly describes the relationship between the features of a stock and its price so that we can accurately predict price from those features in the future.
Consider how we would evaluate such a model. If we test the model using the same data we used for training, we'd have to be suspicious of the result. After all, the model was built using the training data, so it is inherently biased to perform very well on that data.
Instead, we use a technique called out-of-sample testing. In out-of-sample testing, we split our data into two partitions: a training portion and a testing portion.
We call the features that we use for training and the corresponding prices . Similarly, we refer to the data that we test on as and .
First, we pass and to a machine learning algorithm, such as linear regression or KNN, which generates a model. Next, we query the model with , which gives us a set of predictions .
To evaluate the predictive power of the model, we have to compare and . The closer that values in come to ground truth values in , the more accurate the model.
One thing to keep in mind is that financial data is often oriented in time-specific order. As a result, we usually split our data such that we train our on older data and test on newer data. It's generally frowned upon to do the reverse, as certain lookahead biases occur when training in the future and testing in the past.
Learning APIs
It's helpful to standardize the application programming interface (API) when thinking about implementing machine learning algorithms.
We have three fundamental concepts that we need to cover in our API. First, we need to be able to create the learner and pass in any necessary parameters. Second, we need to be able to instruct our learner to build a model from training data. Finally, we need a way to tell our learner to query its model using testing data.
Here is an example of how we might use a linear regression learner:
learner = LinRegLearner()        # Create the learner
learner.train(Xtrain, Ytrain)   # Learn the model
learner.query(Xtest)            # Compute predictions
We can imagine using a KNN learner in a very similar fashion. The only difference with the KNN API is that the constructor takes in an additional argument for specifying .
learner = KNNLearner(k=3)
learner.train(Xtrain, Ytrain)
learner.query(Xtest)
Example for Linear Regression
Let's look at some pseudocode describing a possible implementation of this API for a linear regression learner.
We define our LinRegLearner class, and the associated constructor using the __init__ method. The constructor, in this case, doesn't need to do anything, so we can call pass.
class LinRegLearner:
 def __init__():
  pass
Next, we need to implement the train method. Given a training data set consisting of X and Y, train finds the m and b of the line that best fits the data.
class LinRegLearner:
 # ... #
 def train(X, Y):
  self.m, self.b = favorite_linreg(X, Y)
We can use any of several regression algorithms at our disposal as part of SciPy and NumPy to find m, and b, and we store these parameters as instance variables on the learner.
Finally, the query method takes in X as an argument and computes the corresponding Y.
class LinRegLearner:
 def query(X):
  return self.m * X + self.b
A KNN learner would have the same API, although its constructor would look a little different because we want to be able to specify :
class KNNLearner:
 def __init__(k):
  self.k = k
Enforcing that all learners implement the same API is advantageous because, once we know how to use one learner, we know how to use them all.
OMSCS Notes is made with in NYC by Matt Schlenker.
Copyright © 2019-2023. All rights reserved.
privacy policy